piecewise regression 개념 및 실습
개요
데이터 분석에서 Regression(회귀 분석)은 가장 기본적이고 많이 쓰이는 기법 중 하나이다. 그러나 현실의 데이터는 대체로 비선형적인 특징을 갖고 있으며, 단순 선형 회귀 모델만으로는 이러한 복잡한 패턴을 설명하기 어렵다.
예를 들어, 사람의 나이에 따른 건강 지표, 시간에 따른 판매량, 특정 공정의 물성치 등은 구간별로 전혀 다른 추세를 가지는 경우가 많다. 이런 상황에서 단일 직선이나 고차 다항식으로 전체 데이터를 설명하려 하면 오차(MSE, Mean Squared Error)가 커지거나, 불필요하게 복잡한 모델을 쓰게 되는 문제가 생긴다.
이때 유용한 방법이 바로 piecewise regression(구간별 회귀)이다. 데이터를 여러 구간으로 나누어 각 구간마다 다른 선형 모델을 적용하는 방식으로, 전체 데이터를 더 잘 설명할 수 있다.
piecewise regression을 쓰는 이유
일반적인 선형 회귀는 전체 데이터에 하나의 직선을 적합시키지만, 데이터가 구간마다 다른 패턴을 가질 경우에는 성능이 떨어진다. 반면, piecewise regression은 데이터를 여러 구간으로 나누어 각 구간마다 회귀식을 따로 세움으로써,
- MSE를 줄이고,
- 데이터의 구간별 특성을 더 정확히 반영할 수 있으며,
- 모델의 해석력을 높일 수 있다.
piecewise Regression의 기본 아이디어
구간별 regression은 특정지점을 매듭점(breakpoint)로 설정하고 그 전후 구간에 대해서 다른 모델로 regression한다.
예를들어 구간별 linear regression을 적용한다고 해보자.
예를 들어 매듭점이 $x = c$일 때
\[y =\begin{aligned}a_1 + b_1 x & \quad (x \leq c) \\a_2 + b_2 x & \quad (x > c)\end{aligned}\]여기서 두 직선이 연속적이이려면, 매듭점에서 값이 같아야한다.
\[a_1 + b_1 c = a_2 + b_2 c\]이를 정리하면 다음과 같이 표현할 수 있다.
\[y =\begin{aligned}a_1 + b_1 x & \quad (x \leq c) \\\{a_1 + c(b_1 - b_2)\} + b_2 x & \quad (x > c)\end{aligned}\]즉, 단 하나의 단일 직선이 아니라, 연속된 여러 직선 조각의 모음으로 regression식을 얻을 수 있다.
Piecewise Regression의 분류
piecewise regression은 크게 두 가지로 나눌 수 있다.
- 구간을 이미 아는 경우: 구간의 경계가 주어져 있으며, 각 구간마다 별도의 회귀식을 학습하면 된다.
- 구간을 모르는 경우: 경계 위치나 개수가 주어지지 않은 상태에서, 데이터로부터 직접 구간을 찾아야 한다.
앞서 설명한 예시는 구간을 이미 아는 경우였고, 이제 구간을 모르는 경우를 살펴보겠다.
구간을 모르는 경우
구간을 모르는 경우는 다시 두 가지 상황으로 나눌 수 있다.
1) 구간의 개수는 알지만, 경계 위치를 모르는 경우
이 경우에는 몇 개의 구간이 존재한다는 사실은 알지만, breakpoint가 어디인지는 모른다.
따라서 break 위치를 찾는 것이 핵심이다. 보통 다음과 같은 방법이 쓰인다:
- 눈으로 추정(고정된 데이터라면 눈으로 보는게 좋을수도 있다.)
- 최적화 기반 방법:
- 여러 후보 breakpoint를 가정하고, 각 경우마다 구간별 회귀를 수행하여 SSE(합제곱오차)를 계산한다.
- 그중 가장 SSE가 작은 위치를 최적 breakpoint로 선택한다.
- 동적 프로그래밍(DP): 여러 구간을 동시에 고려하면서 전체 SSE를 최소화하는 breakpoint 조합을 효율적으로 탐색한다.
from dataclasses import dataclass
from typing import List, Optional
import numpy as np
import matplotlib.pyplot as plt

def _prefix_xy(x: np.ndarray, y: np.ndarray):
    def pref(a):
        return np.concatenate([[0.0], np.cumsum(a)])
    return dict(
        Sx=pref(x), Sy=pref(y), Sxx=pref(x * x), Syy=pref(y * y), Sxy=pref(x * y)
    )

def _interval_scatter(pref, i: int, j: int):
    Sx = pref["Sx"][j + 1] - pref["Sx"][i]
    Sy = pref["Sy"][j + 1] - pref["Sy"][i]
    Sxx = pref["Sxx"][j + 1] - pref["Sxx"][i]
    Syy = pref["Syy"][j + 1] - pref["Syy"][i]
    Sxy = pref["Sxy"][j + 1] - pref["Sxy"][i]
    n = j - i + 1
    if n <= 1:
        return 0.0, 0.0, 0.0, n
    Cxx = Sxx - (Sx * Sx) / n
    Cyy = Syy - (Sy * Sy) / n
    Cxy = Sxy - (Sx * Sy) / n
    return Cxx, Cyy, Cxy, n

def _interval_tls_sse(pref, i: int, j: int) -> float:
    Cxx, Cyy, Cxy, n = _interval_scatter(pref, i, j)
    if n <= 1:
        return 0.0
    tr = Cxx + Cyy
    det = Cxx * Cyy - Cxy * Cxy
    disc = max(0.0, tr * tr - 4.0 * det)
    lam_min = 0.5 * (tr - np.sqrt(disc))
    return float(max(0.0, lam_min))

def find_by_dp(
    xy_sorted: np.ndarray, n_breakpoints: int, min_seg_points: int
) -> List[int]:
    N = xy_sorted.shape[0]
    K = max(1, n_breakpoints + 1)
    if N < K * min_seg_points:
        K = max(1, N // max(1, min_seg_points))
    if K <= 1 or N < 2:
        return []
    x = xy_sorted[:, 0]
    y = xy_sorted[:, 1]
    pref = _prefix_xy(x, y)
    dp = np.full((K + 1, N + 1), np.inf, dtype=np.float64)
    prv = np.full((K + 1, N + 1), -1, dtype=np.int32)
    dp[0, 0] = 0.0
    for k in range(1, K + 1):
        j_min = k * min_seg_points
        for j in range(j_min, N + 1):
            i_min = (k - 1) * min_seg_points
            i_max = j - min_seg_points
            best_cost, best_i = np.inf, -1
            for i in range(i_min, i_max + 1):
                if not np.isfinite(dp[k - 1, i]):
                    continue
                sse = _interval_tls_sse(pref, i, j - 1)
                cost = dp[k - 1, i] + sse
                if cost < best_cost:
                    best_cost, best_i = cost, i
            dp[k, j] = best_cost
            prv[k, j] = best_i

    cuts = []
    k, j = K, N
    while k > 0:
        i = int(prv[k, j])
        if i < 0:
            break
        cuts.append(i)
        j = i
        k -= 1
    cuts = sorted(cuts)
    interior_starts = [c for c in cuts if 0 < c < N]
    interior_breaks = [s - 1 for s in interior_starts]
    return interior_breaks

# ---------- LineModel ----------
@dataclass
class LineModel:
    # n·x = d (Hessian), ||n||=1
    n: np.ndarray
    d: float
    t: np.ndarray
    c: np.ndarray
    p0: np.ndarray
    p1: np.ndarray

    @staticmethod
    def from_tls(pts: np.ndarray) -> "LineModel":
        c = pts.mean(axis=0)
        A = pts - c # 가장 큰 고유값의 고유벡터가 선의 방향
        _, vecs = np.linalg.eigh(A.T @ A)
        t = vecs[:, 1] / (np.linalg.norm(vecs[:, 1]) + 1e-12) # 주성분
        n = np.array([-t[1], t[0]]) # t에 수직
        if n.dot(c) < 0: # d>=0 되도록 방향 통일
            n = -n
        d = n.dot(c)
        s = (pts - c) @ t # scalar projections
        smin, smax = np.min(s), np.max(s)
        p0 = c + smin * t
        p1 = c + smax * t
        return LineModel(n=n, d=d, t=t, c=c, p0=p0, p1=p1)

    @property
    def length(self) -> float:
        return float(np.linalg.norm(self.p1 - self.p0))

    # ---------- piecewise TLS splitter ----------
def piecewise_tls_lines(
    xy: np.ndarray, n_breakpoints: int, min_seg_points: int = 20
):
    xy = np.asarray(xy, dtype=float)
    mask = np.isfinite(xy).all(axis=1)
    xy = xy[mask]
    if xy.shape[0] < max(2, (n_breakpoints + 1) * max(1, min_seg_points)):
        if xy.shape[0] < 2:
            return []
        lm = LineModel.from_tls(xy)
        return [lm]
    interior_breaks = find_by_dp(
        xy, n_breakpoints=n_breakpoints, min_seg_points=min_seg_points
    )
    bounds = [-1] + interior_breaks + [xy.shape[0] - 1]
    lines = []
    pts_list = []
    for k in range(len(bounds) - 1):
        i0 = bounds[k] + 1
        i1 = bounds[k + 1]
        pts = xy[i0 : i1 + 1]
        if pts.shape[0] < 2:
            continue
        lines.append(LineModel.from_tls(pts))
        pts_list.append(pts)
    return lines, interior_breaks

# ---------- minimal demo ----------
def _make_demo_points(n1=120, n2=140, noise=0.01, seed=0):
    rng = np.random.default_rng(seed)
    # seg1: y = 0.2x + 0.5, x in [0, 2.5]
    x1 = np.linspace(0.0, 2.5, n1)
    y1 = 0.2 * x1 + 0.5
    P1 = np.stack([x1, y1], axis=1) + rng.normal(0, noise, size=(n1, 2))
    # seg2: y = -0.1x + 1.2, x in [2.6, 6.5]
    x2 = np.linspace(2.6, 6.5, n2)
    y2 = -0.1 * x2 + 1.2
    P2 = np.stack([x2, y2], axis=1) + rng.normal(0, noise, size=(n2, 2))
    return np.vstack([P1, P2])

if __name__ == "__main__":
    xy = _make_demo_points()
    model, _ = piecewise_tls_lines(xy, n_breakpoints=2, min_seg_points=10)
    print(f"#segments = {len(model)}")
    for i, ln in enumerate(model, 1):
        print(f"seg{i}: len={ln.length:.3f}, t={ln.t}, n={ln.n}, d={ln.d:.3f}")

    plt.figure(figsize=(7, 4.5))
    plt.scatter(xy[:, 0], xy[:, 1], s=10, alpha=0.7, label="points")
    for i, ln in enumerate(model, 1):
        plt.plot([ln.p0[0], ln.p1[0]], [ln.p0[1], ln.p1[1]], label=f"seg{i}")
    plt.title("Piecewise TLS (self-contained)")
    plt.xlabel("x")
    plt.ylabel("y")
    plt.legend()
    plt.tight_layout()
    plt.show()
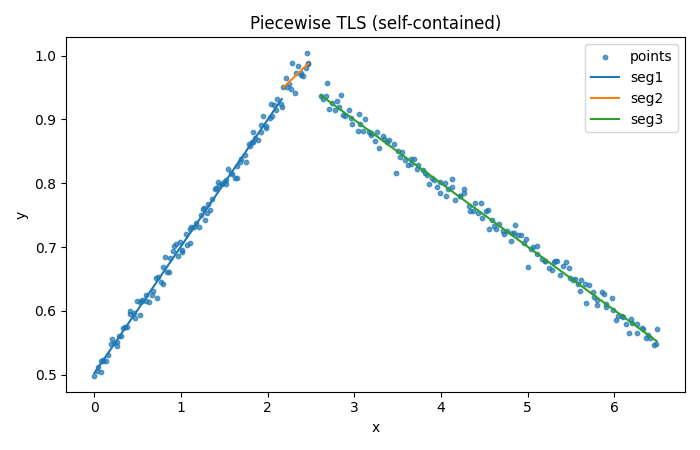
결과
#segments = 3
seg1: len=2.205, t=[-0.98084461 -0.19479182], n=[-0.19479182  0.98084461], d=0.493
seg2: len=0.291, t=[-0.99164729 -0.12897923], n=[-0.12897923  0.99164729], d=0.661
seg3: len=3.895, t=[-0.99510089  0.09886464], n=[0.09886464 0.99510089], d=1.191
2) 구간의 개수와 경계 위치 모두 모르는 경우
이 경우는 더 일반적인 상황으로, 몇 개의 세그먼트가 필요할지 자체도 데이터로부터 추정해야 한다.
접근 방법:
- 모델 선택 기준: 여러 개수의 세그먼트를 가정하고, 각 경우마다 회귀를 수행한 뒤 AIC, BIC, Cross-validation error 등을 비교하여 가장 적절한 세그먼트 수를 선택한다.
- Machine Learning 기반: Decision Tree Regression, Segmented Regression 같은 모델들은 자동으로 데이터의 분할 위치와 개수를 학습한다.
- Greedy 방법: 한 개 구간에서 시작하여 오차가 큰 부분을 기준으로 반복적으로 쪼개면서 적절한 세그먼트 수를 찾는다.
- Bayesian 접근: 매듭점의 개수와 위치를 확률 변수로 두고, posterior distribution에서 추론한다.
이 과정에서는 overfitting이 쉽게 발생할 수 있기 때문에, 불필요하게 많은 구간을 두지 않고 일반화 성능을 고려한 선택이 중요하다.
from dataclasses import dataclass
from typing import List, Optional, Tuple, Dict
import numpy as np
import matplotlib.pyplot as plt
# ~~~~~~~~~~~ 동일함수 생략 ~~~~~~~~~~~~~~

# ---------- piecewise TLS splitter ----------
def _total_tls_sse_from_bounds(xy: np.ndarray, interior_breaks: List[int]) -> float:
    """현재 분할에 대한 총 TLS SSE(각 구간 lam_min의 합)"""
    x = xy[:,0]; y = xy[:,1]
    pref = _prefix_xy(x, y)
    bounds = [-1] + interior_breaks + [xy.shape[0]-1]
    total = 0.0
    for k in range(len(bounds)-1):
        i0 = bounds[k] + 1
        i1 = bounds[k+1]
        total += _interval_tls_sse(pref, i0, i1)
    return float(total)

def _ic_from_sse(sse: float, N: int, S: int, criterion: str = "AIC") -> float:
    # 각 선: 방향/거리 2개
    # 내부 breakpoint: (S-1)개
    #p = 2*S + (S-1) = 3S - 1
    p = max(1, 3*S - 1)

    if N <= 0:
        ll = -np.inf
    else:
        # 정규 오차 가정: sigma^2 = sse / N
        sigma2 = max(1e-12, sse / max(1, N))
        ll = -0.5 * N * (np.log(2*np.pi*sigma2) + 1.0)

    if criterion.upper() == "BIC":
        return p * np.log(max(1, N)) - 2.0 * ll
    # default AIC
    return 2.0 * p - 2.0 * ll

# ---------- Auto-select segment count by AIC/BIC ----------
def piecewise_tls_auto(xy: np.ndarray,
                       max_segments: int = 5,
                       min_seg_points: int = 20,
                       criterion: str = "BIC"):
    """
    segment 수 S=1..max_segments 를 시도해 AIC/BIC 최소가 되는 breakpoint를 선택.
    반환: (best_lines, best_breaks, report(dict))
    """
    xy = np.asarray(xy, float)
    mask = np.isfinite(xy).all(axis=1)
    xy = xy[mask]
    N = xy.shape[0]
    best_ic = np.inf
    best = ([], [])
    report = []  # list of dicts per S

    for S in range(1, max_segments+1):
        n_breaks = S - 1
        lines, breaks = piecewise_tls_lines(xy, n_breakpoints=n_breaks, min_seg_points=min_seg_points)
        if not lines:
            continue

		# total TLS SSE
        sse = _total_tls_sse_from_bounds(xy, breaks)
        ic = _ic_from_sse(sse, N, S, criterion=criterion)
        report.append(dict(S=S, breaks=breaks, SSE=float(sse), IC=float(ic)))
        if ic < best_ic:
            best_ic = ic
            best = (lines, breaks)

    report = sorted(report, key=lambda d: d["IC"])
    return best[0], best[1], report

def _make_demo_points(n1=120, n2=140, noise=0.01, seed=0):
    rng = np.random.default_rng(seed)
    x1 = np.linspace(0.0, 2.5, n1); y1 = 0.2 * x1 + 0.5
    P1 = np.stack([x1, y1], axis=1) + rng.normal(0, noise, size=(n1, 2))
    x2 = np.linspace(2.6, 6.5, n2); y2 = -0.1 * x2 + 1.2
    P2 = np.stack([x2, y2], axis=1) + rng.normal(0, noise, size=(n2, 2))
    x3 =  np.linspace(6.5, 8.5, n2); y3 = 0.1 * x3 + 0.1
    P3 = np.stack([x3, y3], axis=1) + rng.normal(0, noise, size=(n2, 2))
    return np.vstack([P1, P2, P3])

if __name__ == "__main__":
    xy = _make_demo_points()
    lines, breaks, report = piecewise_tls_auto(
        xy, max_segments=5, min_seg_points=20, criterion="BIC"  # "AIC"로 바꿔도 됨
    )

    print("=== Model selection report (sorted by IC) ===")
    for r in report:
        print(f"S={r['S']:>2d}, IC={r['IC']:.2f}, SSE={r['SSE']:.3f}, breaks={r['breaks']}")

    print(f"\nChosen by BIC → S = {len(lines)}")
    for i, ln in enumerate(lines, 1):
        print(f" seg{i}: length={ln.length:.3f}, n={ln.n}, d={ln.d:.4f}")

    plt.figure(figsize=(7, 4.5))
    plt.scatter(xy[:, 0], xy[:, 1], s=12, alpha=0.75, label="points")
    for i, ln in enumerate(lines, 1):
        plt.plot([ln.p0[0], ln.p1[0]], [ln.p0[1], ln.p1[1]], label=f"seg{i}")
    # break
    plt.title("Piecewise TLS with AIC/BIC segment selection")
    plt.xlabel("x"); plt.ylabel("y"); plt.legend(); plt.tight_layout(); plt.show()
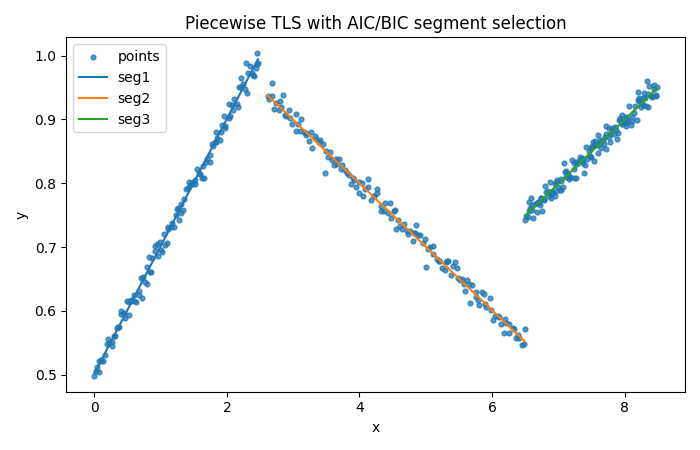
결과
=== Model selection report (sorted by IC) ===
S= 3, IC=-2515.64, SSE=0.039, breaks=[119, 259]
S= 4, IC=-2505.73, SSE=0.038, breaks=[119, 259, 376]
S= 5, IC=-2494.20, SSE=0.037, breaks=[119, 172, 259, 376]
S= 2, IC=-861.56, SSE=2.521, breaks=[150]
S= 1, IC=-590.76, SSE=5.190, breaks=[]

Chosen by BIC → S = 3
 seg1: length=2.516, n=[-0.19562629  0.98067852], d=0.4922
 seg2: length=3.895, n=[0.09886464 0.99510089], d=1.1915
 seg3: length=1.995, n=[-0.09991873  0.9949956 ], d=0.0957